Google Analytics Statistics: How to interpret them
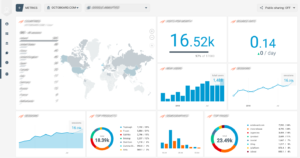
Google analytics is an analytic tool that puts Google at the disposal of all its users. It is free and allows blog and web page users to control different variables related to their content on the network its effectiveness: measuring parameters such as the number of visits, users, pages viewed, session duration or conversions among many more.

Below we explain how to interpret these statistics and how to make use of them, from the easiest to the most complex.
Sessions. How many people visit the website?
A session is an interaction or group of interaction on a website over a given time period. Several clicks in different pages also form part of the same session, as long as they are done by the same user in the open session. Thus, continuing to count as one single session.
To count the number of sessions, just go to the main Analytics reports page, in the overview. By default, the period of time they appear is the last 28 days, although this temporary variable can be changed to see the statistics in another period.
The users. Who visits the webpage?
Another relevant parameter is the total number of users that visit the website. It is not the same as the sessions, since every user that enters the website creates a session. The future sessions of this user are counted as additional sessions. Google Analytics is capable of detecting if there is the same amount of visitors thanks to cookies.
In the beginning a website or blog will have almost only new users, with time and perseverance in generating quality content, the ideal thing is for new users to appear and for those that are already recurring to become loyal.
In analytics the new users are “new visitors”, while the recurring users are called “returning visitors”.
The visitors location
An interesting option, with which we can know which countries visit us and the languages of the readers. From the analysis of this data we already have a clearer idea of where to direct the content, the design of the pages and other variables. This parameter correlates greatly with the business objective. If the business has an area of activity more locally focused, it wont be very useful to get visits from very far away countries.
Total page visits. Does your website have more than one page
On the internet it is possible to create a website with various associated pages. It is very common. The objective to be achieved with this statistic is that the total page visits exceeds the number of sessions achieved as much as possible. This way we certify that users click on the several pages of the same website.
Pages per seassion
Closely related to the previous point we find another statistical curiosity. With analytics we can know the total number of visits to a page in a single session on the internet. A greater ratio shows better interaction from the users, which means that they are comfortable with the content that is offered to them.
The average session duration
The third statistic related to web visits and sessions is average duration. It consists of measuring the time it takes for a user to leave the web. Recently the higher this statistic, the more attention created by the web in its users, which implies greater interactions.
To carry out the calculation, Analytics add the duration of sessions to the period of analysis and divides the time between all the sessions obtained.
Bounce and exit percentages
Many people believe that these two parameters are similar, but in reality they are very different, although they maintain some points in common.
The bounce percentage indicates the total number of users who leave a page after seeing only one page and it does not show more information about how long they stayed or how they arrived. It is advisable to have a low bounce percentage, because the majority of time this happens, it is because there is some problem with the landing page. Either that or the website is boring.
On its part, the exit percentages measure situations a user enters a web page and leaves it, finishing the session. A high exit percentage is not always negative for a website, because many pages can have the function: order confirmations. If it is an online shop, it is normal for a person when they finalize a purchase to leave the website.
In any case, if there is a high exit percentage on some pages not destined for this purpose, you will have to start to asking the same questions as with high bounce rates.
To measure this statistic we must go to behaviour >> General Vision. And in the case of wanting to check the exit rate on each specific page: Behavior >> Site content >> Exit pages.
Conversions what does a user do on the web?
Web conversion is everything to do with actions expected of a user when arriving at a website. This is perhaps one of the most important metrics.
There are various degrees of conversion: converting visitor into subscriber, who filling in a certain form, completing a certain purchase or visiting a certain page.
Conversions are an important statistic, because it is a convenient way to measure the success of a website. A high percentage of conversions indicates that a website is well designed and the target it is aimed at is the right one. On the other hand, if this parameter is low, it is possible that we are attracting an unsuitable sector of the public, where the web does not convince the users or where the products and services offered do not interest them.
The way of measuring conversions is to go on Conversions and from her to Objectives. Google Analytics allows you to mark out the objectives you wish to fulfil.
